Advanced Options of Graphical Analysis
From Business Process Management, BPM and Workflow Automation Wiki | BizAgi BPMS
<keywords content="keywords">
dimensions, filters, filters on dimensions, arrange dimensions, saving graphical analysis, delete
</keywords>
Contents |
How to Apply Filters on Dimensions
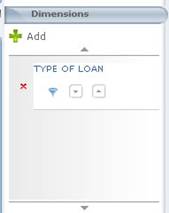
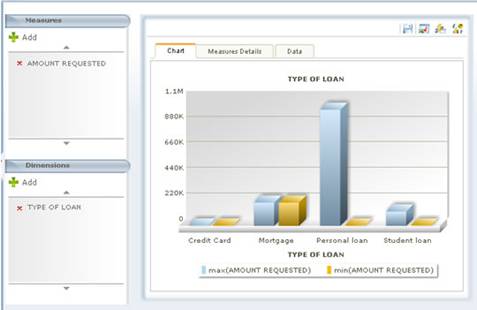
1.In the dimensions element of the Graphic Analyzer, click on the icon across from each dimensions that has been selected.
2. Icons are displayed under the name of the dimension. Click on the icon to apply the filter.
3. Different windows are displayed depending on the type of dimension.
![]() For filters of dimensions other than dates:
For filters of dimensions other than dates:
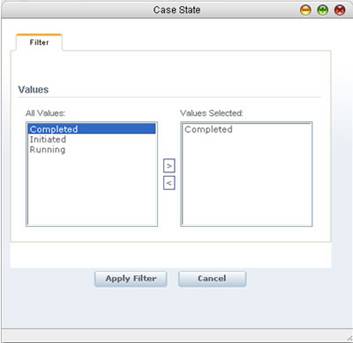
Two lists are viewed in the window:
All Values: All the possible values available for the dimension to be filtered are displayed.
Values selected: Only values selected to be used in the analysis are displayed.
Use the buttons to go from one list to another.
|
Note:If there are no values on the list of Values selected, no filters are applied and all the values appear in the analysis. |
![]() For filters of the dimensions of time:
For filters of the dimensions of time:
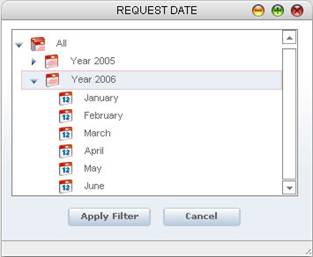
A tree is displayed, hierarchically representing the following levels:
![]() All: The full range of dates found, viewed by years
All: The full range of dates found, viewed by years
![]() Year: Depending on the configuration of the application, the quarters of the year or the months found are displayed, months are configured by default.
Year: Depending on the configuration of the application, the quarters of the year or the months found are displayed, months are configured by default.
![]() Quarter: displays the months of the Quarter, depending on the configuration of the application. By default, this option is disabled.
Quarter: displays the months of the Quarter, depending on the configuration of the application. By default, this option is disabled.
![]() Month: the lowest level of the hierarchy
Month: the lowest level of the hierarchy
4.Select the filter required and click on the Apply Filter button.
How to Arrange the Dimensions that Have Been Added
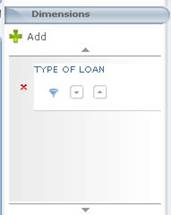
1.In the dimensions element of the Graphic Analyzer, select the dimension to be moved.
2.Icons are displayed under the name of the dimension. Click on the down or up icon depending on your requirements. . ![]()
|
Note: The last dimension on the list is going to represent the X axis on the graphics, and the result tables arrange the information depending on the order of the dimensions that have been added. |
How to Save the Graphic Analysis
1.In the options of the configuration menu, click on the Save Graphical Analysis button.
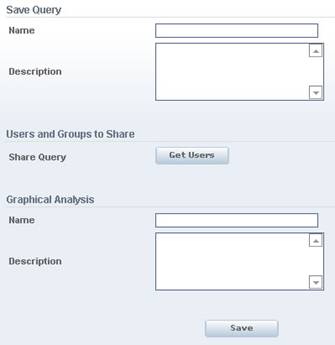
2. If the graphic analysis is being carried out on a query that has been created, the information of the name, description and users/groups to share is that of the selected query and the user can modify this configuration. Otherwise, a new query is saved, recording the information as indicated in How to Save a Query.
3.Complete the following fields in the Graphical Analysis group:
|
Name: Enter the name of the graphical analysis. It can be up to 25 characters long. Description: Enter the information of the description of the analysis so it can be understood when you read the description. |
4.Click on the Save button.
5.In the case area of the web application, in the Bizagi search section, click on the query sub-level and the Graphical Analysis that have been saved ![]() and are available for execution will appear.
and are available for execution will appear.
|
Note:Graphic analyses that have been saved cannot be edited. They can only be deleted. |
How to Delete a Graphic Analysis that Has Been Saved
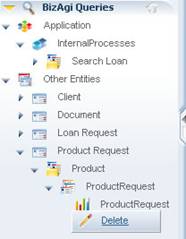
1.In the case area of the web application, in the Bizagi search section, click on the query sub-level and then the saved Graphic Analysis, and right click on the Delete option.
2.In the confirmation window, click on OK.
Export Queries to Excel
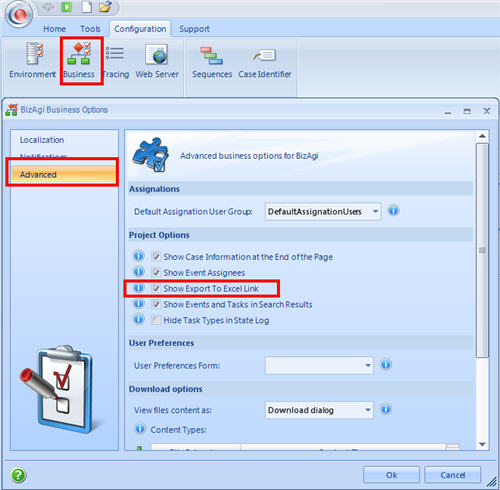
Custom queries generated in the web application can be exported to Excel. This option is configured through the parameters option of the applications component.
1. In the Business Configuration menu, select the Advanced Option.
2.In the Project Options box, enable the option “Show Export to Excel Link”
When making queries, users will find the “Export to Excel” link at the bottom.
<comments />
