Sensor Analytics
From Business Process Management, BPM and Workflow Automation Wiki | BizAgi BPMS
<keywords content="keywords"> phase analytics, reports, paths, path, sensor, sensors, stopwatch </keywords>
Contents |
Sensor Analytics
Bizagi provides organizations with management indicators that are fully comprehensive and easy to interpret based on accurate, real time business information, allowing process owners to make agile flow adjustments and better, more efficient decisions to optimize the performance of business processes.
Through the Sensor Analytics menu and its options Stopwatches and Counters, Bizagi offers a feature as a tool for continuous processes improvement to review and control:
- Time and number of cases between any two tasks in the process
- Number of activations of a given task
- SLA comparisons
- A number of reports and capabilities
Stopwatches
The Stopwatch will determine the number of cases that have passed through the chosen path and the time it has taken to do so. The time is defined from the first time it enters the starting task until the time it leaves the ending task. Only the cases that have completed the whole path are taken into account by the reports. In a single case it is possible to have the same path repeated several times. Thus, a single case can have several instances of a Stopwatch.
There are five different reports for each Stopwatch
![]() Cycle Time Summary
This table shows the number of times the selected path was completed, the minimum time it took as well as the maximum time and the average duration. According to the SLA defined in the Stopwatch table will show the percentage of cases that met the SLA (On time) and the number of cases that did not meet the SLA (Overdue).
Cycle Time Summary
This table shows the number of times the selected path was completed, the minimum time it took as well as the maximum time and the average duration. According to the SLA defined in the Stopwatch table will show the percentage of cases that met the SLA (On time) and the number of cases that did not meet the SLA (Overdue).
![]() Level of Service
Shows for the selected stopwatch the number of cases that took from 0 to more than six days to be completed
Level of Service
Shows for the selected stopwatch the number of cases that took from 0 to more than six days to be completed
![]() Duration Histogram
This chart graphically shows the days the stopwatch instances took to be completed. There is a vertical dashed line that separates on time from overdue instances.
Duration Histogram
This chart graphically shows the days the stopwatch instances took to be completed. There is a vertical dashed line that separates on time from overdue instances.
![]() Duration Trend
This chart graphically shows the average duration time of the stopwatch in the selected time range.
Duration Trend
This chart graphically shows the average duration time of the stopwatch in the selected time range.
![]() Activations vs Closing trend
The stopwatch in the selected time range combines the trends of the number of activations and the number of closures.
Activations vs Closing trend
The stopwatch in the selected time range combines the trends of the number of activations and the number of closures.
The following video will show an example of how to create Stopwatches.
<videoflash>1opcS_NmK7E|640|505|</videoflash>
The following video will show you how to edit Stopwatches.
<videoflash>6yyNLFpa-G0|640|505|</videoflash>
The process selected is Travel Request, from our Process Central.
In the process, an employee requests Approval for a business trip, which can be approved or rejected by the boss. According to the requested trip, the employee might need Airplane ticket, hotel and a travel advance.
Important Stopwatches information
- Stopwatches are created by user: each user defines the paths that he or she considers necessary. These are created in the Work Portal.
- The user can choose to filter by any of the Dimensions previously defined
- Time ranges are also available to choose starting and ending dates
- Each Stopwatch can be deleted or edited at any time
- The Stopwatches can be exported to Excel
Counters
Counters are selected for a specific activity in a process to obtain the number of times the process flow has gone through it. This sensor will be useful to determine indexes of re-processing and loops. This feature will provide data to optimize processes, identifying activation trends, counts and a list of the involved cases.
Cases Counts and Absolute Counts
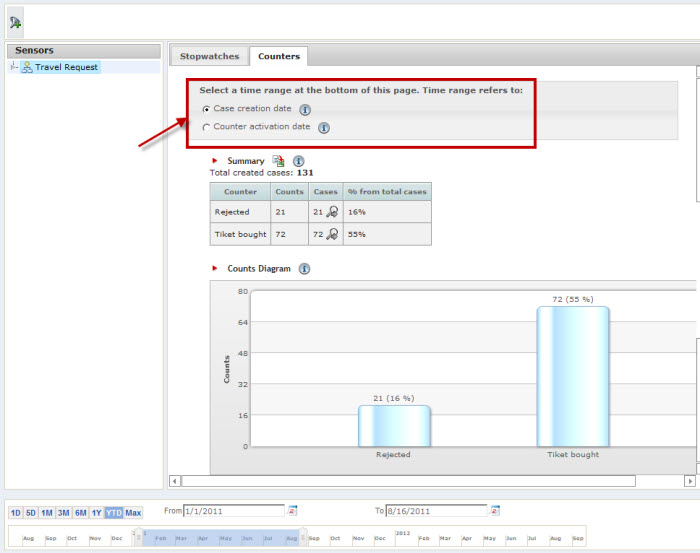
Counters have two views: Case Counts and Absolute Counts.
![]() Case Creation Date
This report will ONLY count the cases that go through the selected activity AND HAVE BEEN CREATED during the chosen period of time. That is, a case that was created during the chosen time period and activated the selected activity will count.
Case Creation Date
This report will ONLY count the cases that go through the selected activity AND HAVE BEEN CREATED during the chosen period of time. That is, a case that was created during the chosen time period and activated the selected activity will count.
![]() Counter activation Date
These Counters will count ALL cases that go through the selected activity regardless of the creation date. That is, any case, either created BEFORE or during the chosen time period, that activated the selected activity will count.
Counter activation Date
These Counters will count ALL cases that go through the selected activity regardless of the creation date. That is, any case, either created BEFORE or during the chosen time period, that activated the selected activity will count.
General and Individual Reports
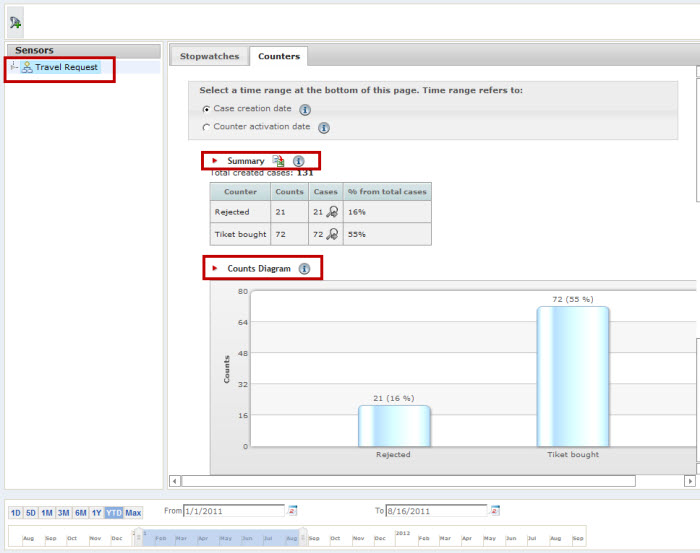
Initially Counters are displayed together for each process, with the process collapsed. The collapsed process will display two reports:
![]() Summary
This table shows the measures of all counters. Each counter will display the count of activations. A case might activate the same activity more than once, and it will count each one. So the number of cases will always be less than or equal to the activity Count. There is also a percentage showing how many cases went through the counter out of all the cases.
Summary
This table shows the measures of all counters. Each counter will display the count of activations. A case might activate the same activity more than once, and it will count each one. So the number of cases will always be less than or equal to the activity Count. There is also a percentage showing how many cases went through the counter out of all the cases.
![]() Counts Diagram
This chart is a Histogram that displays the total count for all Counters of the selected process.
Counts Diagram
This chart is a Histogram that displays the total count for all Counters of the selected process.
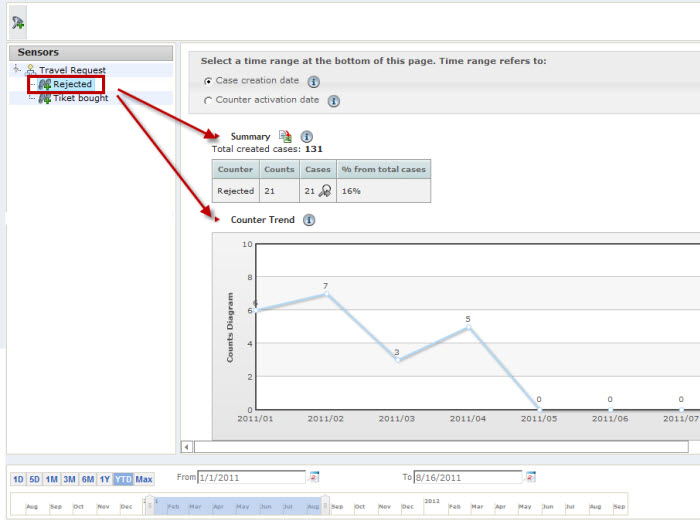
When the user expands the counters of a process, he/she will be able to access the individual counter’s information. Each counter will have two reports:
![]() Summary
This table shows the number of times the selected activity was activated and the number of cases that had the activity. A case might activate the same activity more than once, and it will count each one. So the number of cases will always be less than or equal to the activity Count. There is also a percentage showing how many cases went through the counter out of all the cases.
Summary
This table shows the number of times the selected activity was activated and the number of cases that had the activity. A case might activate the same activity more than once, and it will count each one. So the number of cases will always be less than or equal to the activity Count. There is also a percentage showing how many cases went through the counter out of all the cases.
![]() Counter Trend
This chart graphically shows the trend of the number of activation of the Counter.
Counter Trend
This chart graphically shows the trend of the number of activation of the Counter.
Important Counters information
- Counters are created by user: each user defines the paths that he or she considers necessary. These are created in the Work Portal.
- The user can choose to filter by any of the Dimensions previously defined
- Time ranges are also available to choose starting and ending dates
- Each Counter can be deleted or edited at any time
- Counters can be exported to Excel
The following video will show you how to Create Counters
<videoflash>oQxVQ8wYSjw|640|505|</videoflash>
The following video will show you how to Edit and work with Counters
<videoflash>xtTkbQ22Iv4|640|505|</videoflash>
<comments />


