Tracing Configuration
From Business Process Management, BPM and Workflow Automation Wiki | BizAgi BPMS
<keywords content="keywords">
tracing, errors, warnings, all, traces, activate trace, activate tracing, debug, debugging, debugs
</keywords>
Contents |
Debug And Trace In Bizagi (Tracing)
Overview
During the development process, and in the production environment, there are situations where expression rules, validations, interfaces and even the process needs to be traced, or debugged. Sometimes you might need this to understand unwanted behavior that must be corrected, or just to make sure things are working the way they are supposed to. Thus, users need to identify the origin within many factors.
To identify how things are working traces can be activated to track the execution of the process. Bizagi has a very powerful functionality in which detailed logs and traces can be reviewed after the execution of the process, to monitor at various levels. These levels are: the process and its activities, rules, validations, business policies, interfaces and forms with their fields. In other words, it is possible to track the entire process and the objects that conform the application.
Additionally, you can also select a hierarchy of each item to generate an entire log of everything that happens in the application: warnings and errors or errors only.
How does it work?
The debug and trace feature is oriented to the development environment. However, it can be very useful to detect errors in testing and production environments.
To enable traces, so that you can debug and trace any issue in the work portal, these steps are done: enabling traces (different types) and defining the trace detail.
Enabling traces (different types)
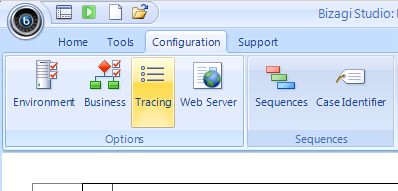
To enable traces, select theTracing option from the standard menu in Bizagi Studio (for the development environment):
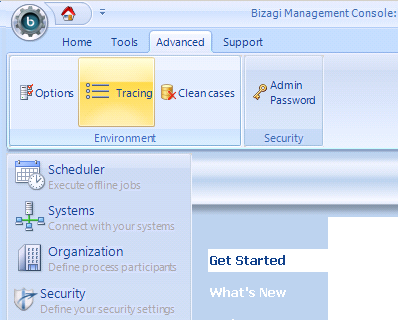
Or you may open the tracing configuration from the Management Console (for Test or Production environments):
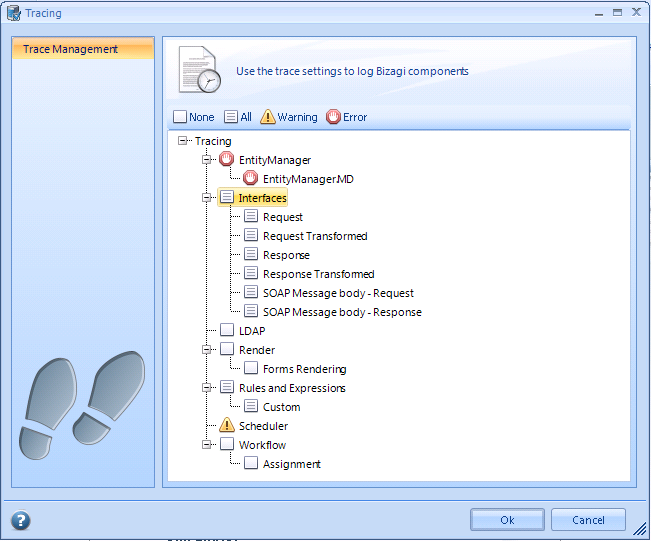
In either, you will see there are different tracing items and types. As in the table below, there are seven main types of traces that can be enabled:
|
Element |
Description |
|
Logs when a transaction begins, when the information is saved in the Data Base, when a case is created and the execution of each shape. When Assignment is selected, it logs the assignment rules execution as well. | |
|
Logs the execution of EntityManager actitivy (database). | |
|
Logs when the SOA layer is used to trace requests and responses. | |
|
Logs the construction of a form in the web application . | |
|
Logs the evaluation of rules and policies. When Custom is selected, it logs the traces wihch the user has defined for the Business Rules (by using the CHelper.trace function). | |
|
Logs the synchronization of LDAP users into Bizagi (as a scheduled task).
| |
|
Logs the execution of the Scheduler's jobs. |
Defining the trace detail
In order to decide what exactly to trace (the detail level), in the selected Tracing option in the Standard Menu, click on the trace type and define its detail level (Error, Warning, All).
- When Error is selected, the text file will only contain error logs.
- When Warning is selected, the trace file will log errors and warnings.
- When All is selected, the file will contain errors, warnings and step by step information about Bizagi's operation.
You may select each trace type (and its subtypes) and select a trace detail configuration for each:
After saving changes on these items, it may be required to restart your server's service (e.g. IISreset in IIS).
Traces location
Once enabled, traces will be located as plain text files on the BPM Server.
This path is different according to the specific web and application server used in the BPM Server.
For Bizagi Xpress or Bizagi Enterprise .Net editions
In projects using IIS (.Net environments), traces will be saved at:
C:\Bizagi\[bizagi_edition]\Projects\[project_name]\Trace
SOA Interfaces traces will be located separate from the previous path, and they will be located at:
C:\Bizagi\[bizagi_edition]\Projects\[project_name]\SOA
For Bizagi Enterprise JEE
In projects using a JEE Application server (Java-based applications), traces will be saved in a different path, according to the technology platform.
In Linux based OS, this path will be the temporary folder for the user (as previously defined and configured in the OS).
In Windows OS, this path will be:
C:\Windows\Temp
SOA Interfaces traces will be located separate from the previous path, and they will be located at the Application server's bin folder.
JEE Additional considerations
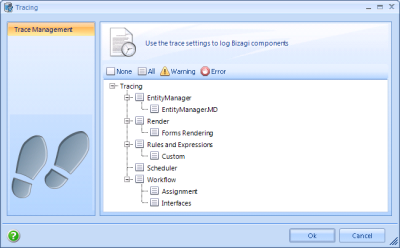
For Bizagi Enteprise JEE edition, the following window is presented but all traces are available except the SOAP message body Request and Response files (of the Interfaces category):
Examples
As previously treated, there is more than 1 type of trace.
The most frequently used traces are those which record the work portal's execution log, record files with custom information from the execution of business rules (expression traces), and those which are automatically generated by Bizagi in web services invocations (SOA interfaces traces).
Work portal (web application) trace
All the necessary information for the tracking of a process is recorded on a file in the BATrace_Web folder.
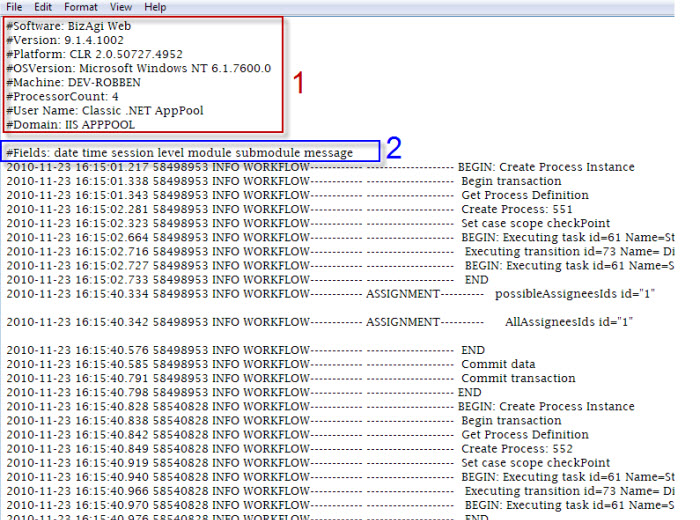
The following is a sample work portal trace file:
1. In the first part of the file, the header has important information about the software, version and platform that is running the Web application.
2. Then there are the names of the columns in order to interpret the data. For example, record date of event, level, module, submodule and message.
3. Within the modules are the objects that run the entire workflow and rules, assignments, workflow, gates, policies, validations etc.
4. Within each event message, there is detailed description of what is happening when you start such an activity, the number that the case has generated, user IDs assigned tasks and more step by step information.
5. If an error occurs, it will appear in the file ERROR WORKFLOW. The file will contain detailed information about the error message to be interpreted.
Expression traces (Rules)
Besides activating the traces levles and options, to generate traces in Expressions it is necessary to include a trace command in the Expression's code to identify exactly what the user wants to trace within the rule.
Follow this link for further information about Traces in Expressions
SOA Interfaces traces
The utility to trace the SOA interfaces invocations has a great level of detail in Bizagi, providing the possibility to see the message sent (Request) and response (Response) from the external system, along with the results of applied transformations. In this way, we can detect in which side of the communication there is an error when it shows up.
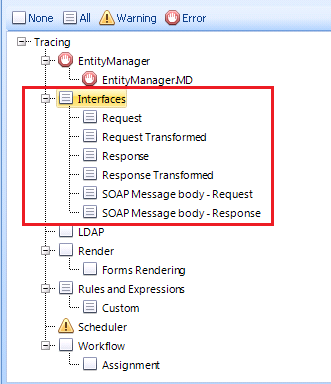
If an error occurs in an interface, you must enable the function of traces at the interfaces (Tracing-Workflow-Interfaces) then review the records and confirm that messages and their structure are consistent with the structure of the Bizagi datamodel.
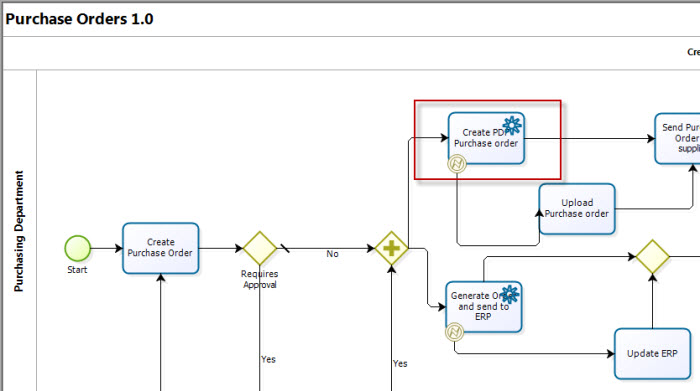
For example, if the interface to generate the purchase order (pdf) in the Purchase Order process, fails, you must enable the traces and check the generated files in order to detect the communication failure.
With the following steps, we will illustrate how to use SOA interfaces trace to detect and diagnose issues in external web services invocations.
1. Detect the error
In this case, the error was thrown in an asynchronous activity. Further error detail can be viewed from the Admin menu, in the "Asynchronous Work item Retries" option.
2. Setup the trace configuration
3. Run the interface again to reproduce the error
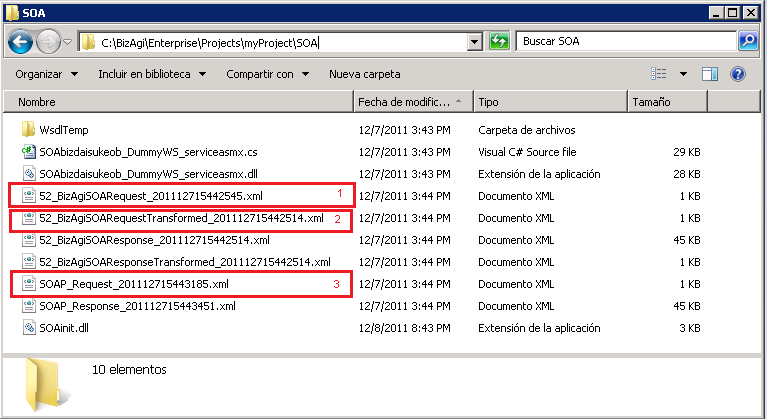
Go to the SOA interfaces traces folder (in this .Net example, this location would be C:\Bizagi\[bizagi_edition]\Projects\[project_name]\SOA.
Note that there are 6 types of XML file for each attempt of communication. For easy identification, the name of these files is formed by case number, file type and date and time they were executed.
There are 6 types of file :
- Request
- RequestTransformed
- SOAP Body Request
- Response
- ResponseTransformed
- SOAP Body Response
It is important to note that not all cases have the 6 files. For example, if an error occurs in the extraction of data from Bizagi, then only the first file (Request) will appear because the error occurred before the request.
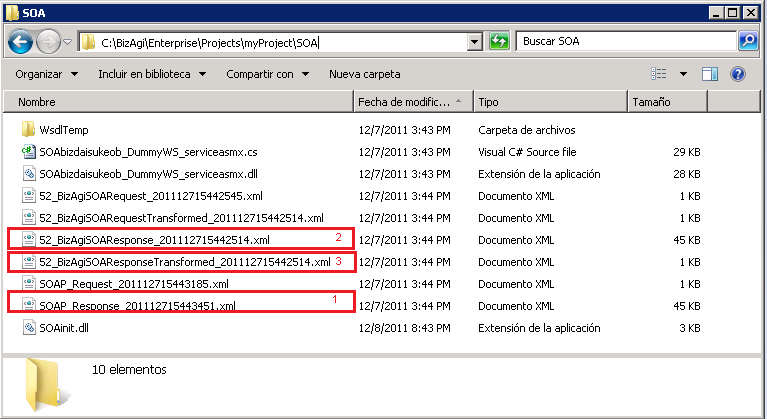
On the other hand, if the interfaces do not handle transformations, the transformed files will not appear. The following images show the 6 types of SOA tracing files.The first image highlights the request traces in chronological order:
1. Request saves the information obtained from Bizagi.
2. RequestTransformed saves the information obtained from Bizagi after having applied an XSLT transformation.
3. SOAPBody Request saves the XML body content of the information just as it is sent to the external system (notice the SOAP header is not included as this information may contain private security information, such as authorized credentials).
This image highlights the response traces in chronological order:
1. SOAPBody Response saves the XML body content of the information just as it is received from the external system (again, the SOAP header is not included).
2. Response saves the information received from the external system presented as the input for Bizagi.
3. ResponseTransformed saves the information received once Bizagi has applied an XSLT transformation.
4. Validate the files one by one to identify the error
In this case, if we observe the response of service in the file: BizagiSOARequestTransformed, we see that the response has the <Quotation> tag, but the entity is called Quotations, thus generating the error message "Quotation: Relationship not found. "
Related Articles
<comments />
