Analysis Reports Analytics
From Business Process Management, BPM and Workflow Automation Wiki | BizAgi BPMS
<keywords content="keywords"> improve, improvement, data, analize, analizing, chart, charts, improves, statistic, statistics, process </keywords>
Contents |
Analysis Reports: Process and Task Analytics
Bizagi provides organizations with management indicators that are fully comprehensive and easy to interpret based on accurate, real time business information, allowing process owners to make agile flow adjustments and better, more efficient decisions to optimize the performance of business processes. In order to display accurate information in all the options in this module, it is necessary to define not only the duration of the tasks, but also the process estimated duration in the processes' properties.
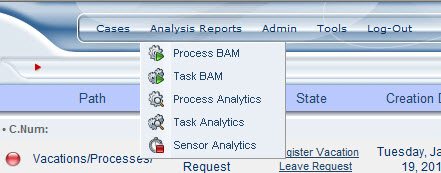
As a tool for continuous processes improvement, Bizagi provides a set of indicators that show the current status of ongoing cases and activities in the system, Business Activity Monitoring or BAM, and the performance that the different processes have had, Analytics. Entering the Analysis Reports menu from the web application, Bizagi provides four indicator groups:
Presents summaries of the cases and activities that are currently closed
Presents information of closed activities that belong to closed cases
Provides information on the current status of ongoing cases
Provides information on the current status of ongoing activities
Provides information of the phases (or paths) defined by the user.
Process Analytics
These indicators present summaries of the cases and activities that are closed. The user can choose to filter by Process or any of the Dimensions previously defined. Process Analytics is divided into four sections: Cycle Time, Duration Histogram, Process Activity and Activation Ranking.
Cycle Time
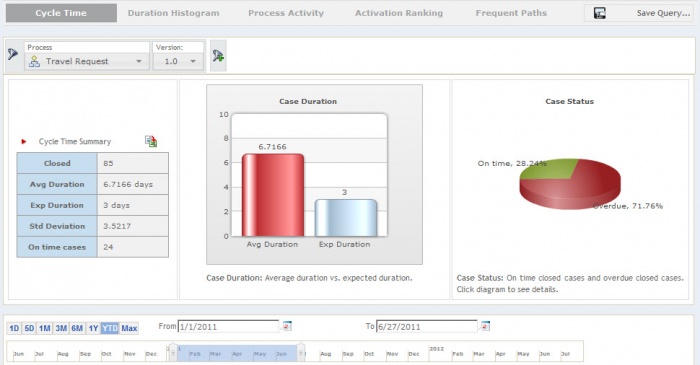
The chart shows a summary that contains the number of closed cases for the chosen process, average duration, expected duration, standard deviation and number of cases completed on time. At the bottom of the screen, there is a time filter that applies to the termination date of the cases. Completed cases DO NOT include aborted cases. The chart compares the average time duration against the expected duration. The graph on the right, Case Status, shows closed cases divided into two groups: On time and overdue.
Duration Histogram
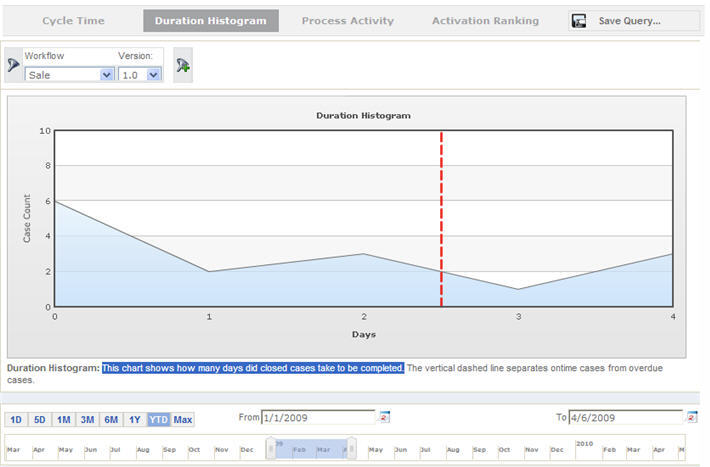
This chart shows how many days closed cases have taken to complete. The vertical dashed line separates on time cases from overdue cases. The time filter applies to the termination date of the cases.
Process Activity
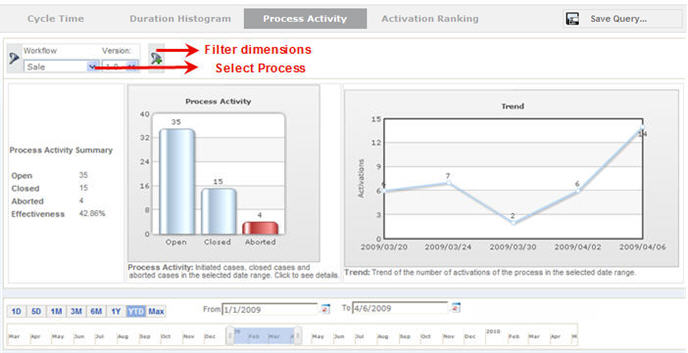
This tab shows a summary that contains the number of cases created (Open), the number of completions (Closed) and the number of aborted cases during the date range selected, along with an effective value (Effectiveness) obtained from the ratio of closed over created. The Process Activity chart compares initiated cases, closed cases and aborted cases in the selected date range. The Trend graph shows the number of activations of the process in the selected date range.
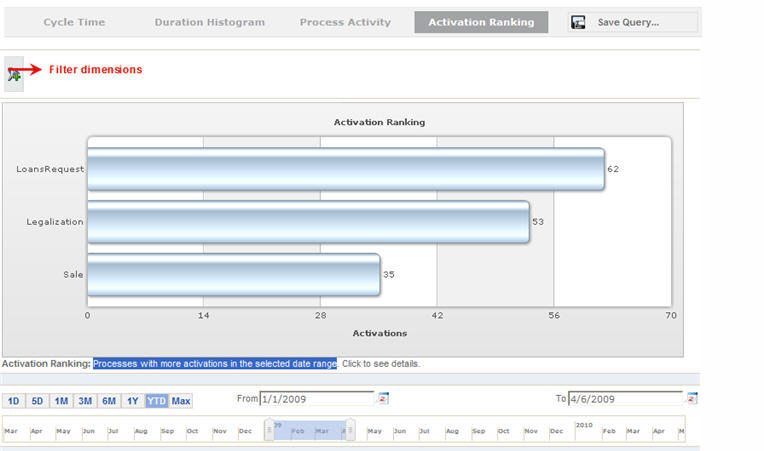
Activation Ranking
A bar graph shows all processes ordered by the number of activations each one has had, in the selected date range
Frequent Paths
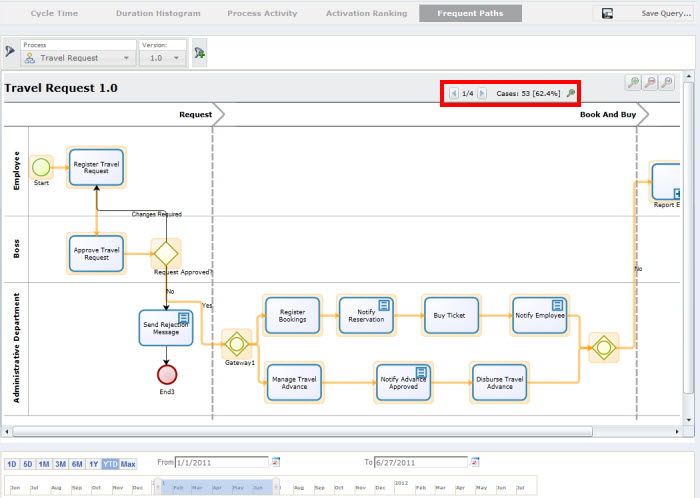
Bizagi also offers the possibility to show the most frequented paths in a specific process. This option allows the user to identify the business cases in the process that are more common and make decisions based on these statistics. As an example, we are going to use the Travel Request process. The manager of the Human Resources area should expect that most of the requests are indeed approved and need Bookings. The manager checks for the Frequent Paths. There will be paths available only if there are closed cases. Ongoing cases will not be displayed in this report.
In this option Bizagi will identify and show the most common paths in the process. It calculates the percentage of closed cases that went through a specific path among all the closed cases for the process (not aborted cases). In the example, the user can verify that 62.4% of the cases have passed through the highlighted path (approved with travel advance and with bookings). The user can deduct from this result that the majority of requests have been approved (as expected), but many of them require advance. To reduce these manual activities the Manager could think of providing Corporate Credit Cards for everyone traveling.
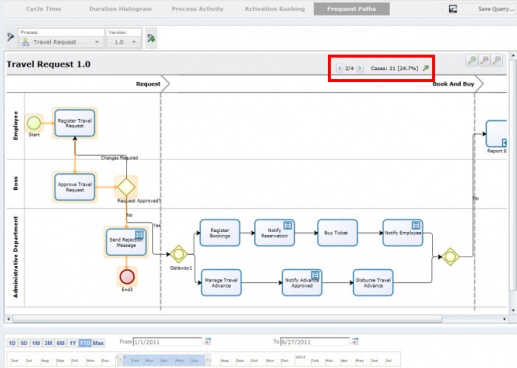
The user can also verify which other paths have been used frequently and get the percentage of use. Bizagi will highlight each one of the other paths as well. In the image below, the user can verify that only 24.7% of the cases were not approved.
Task Analytics
This menu presents information of closed activities that belong to closed cases (not including aborted cases). Activities can be filtered by process version and User dimensions. It has just one section: Cycle Time.
Cycle time
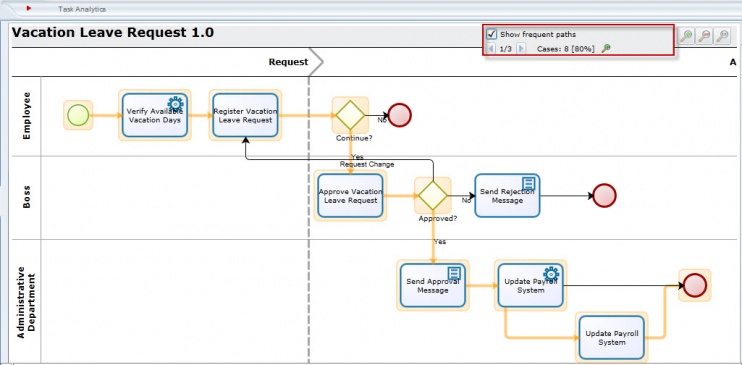
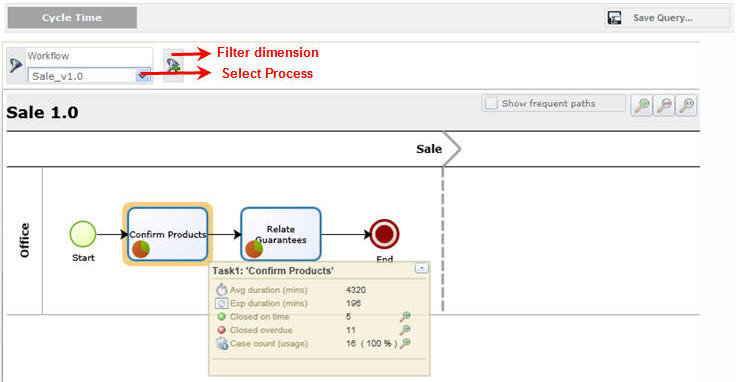
Shows the process flow for the selected process, displaying for each task the number of manual activities completed divided into two groups: On time and delayed. The two measures are shown by a small pie-chart on the task. When the task has uncompleted activities the task will show a pie chart with its information. These activities do not include aborted cases. By clicking on any given task a small window displays a summary of the relevant measures: Average duration, Expected duration, (number of activities) Closed on time, (number of activities) Closed overdue and Cases count (number of cases that successfully passed the task).
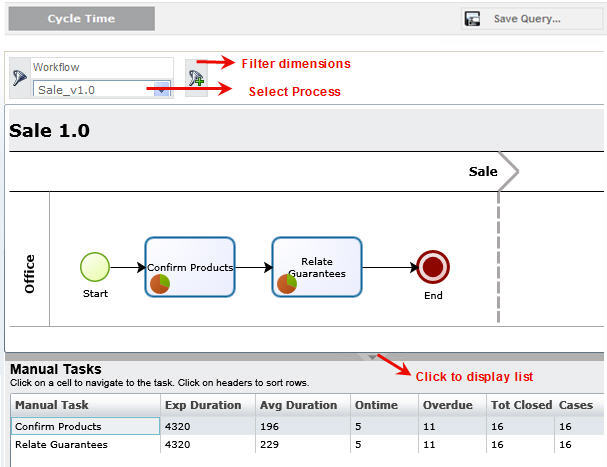
At the bottom of the diagram there is a list, hidden by default, that displays all the manual tasks, indicating for each one the expected duration, average duration, number of activities closed on time, number of activities closed overdue and total number of cases that went through. Click on any given task to display the diagram. The columns can be reordered by dragging each heading.
Cases Details
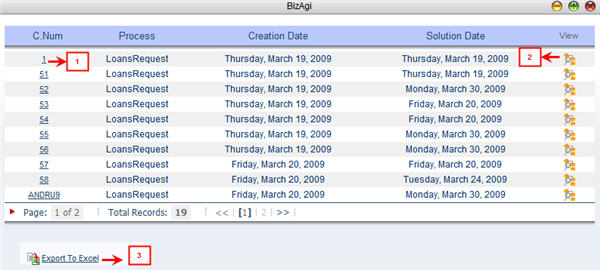
Click on any part of the chart to display a list of all the cases relating to that part. This list can be exported to Excel by clicking on the link at the bottom of the screen (marked by the number 3 in the image below).
1. Click on the case number to enter the case.
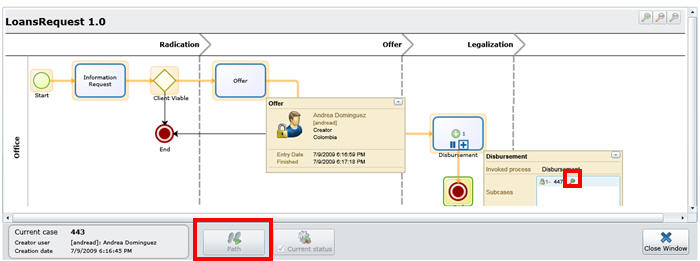
2. Click in the View column to see the state of case within the process and its trail.
Save Report
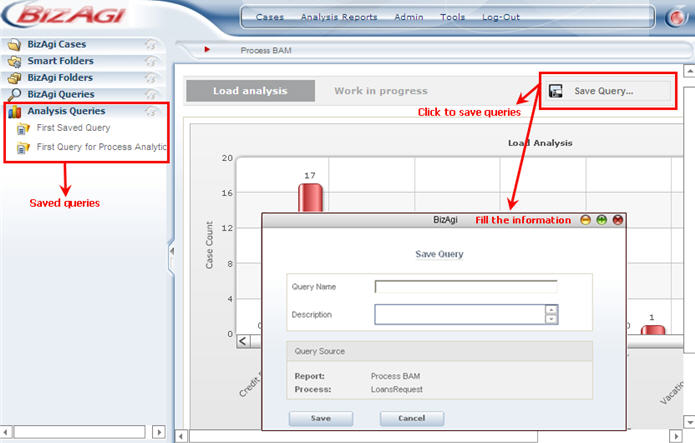
Process Analytics and Task Analytics include a "Save Query" button.
This feature will save queries, that will be available on the left panel in the "Analysis Queries" section for further analysis and decision making.
Saved queries are visible only for the user that creates them.
Related information
- Improve Bizagi's BPM server performance and availability allowing reports to be accessed from a replicated database and not from the Principal one.
- User Dimensions
<comments />
